


Every team runs on time, tasks, and trust. But when projects stall, reports scatter, and visibility fades, you don’t just lose hours. You lose momentum.
That’s why every TeamTrace update is built to strip away the noise, sharpen your control, and give you a clearer picture of your work in motion.
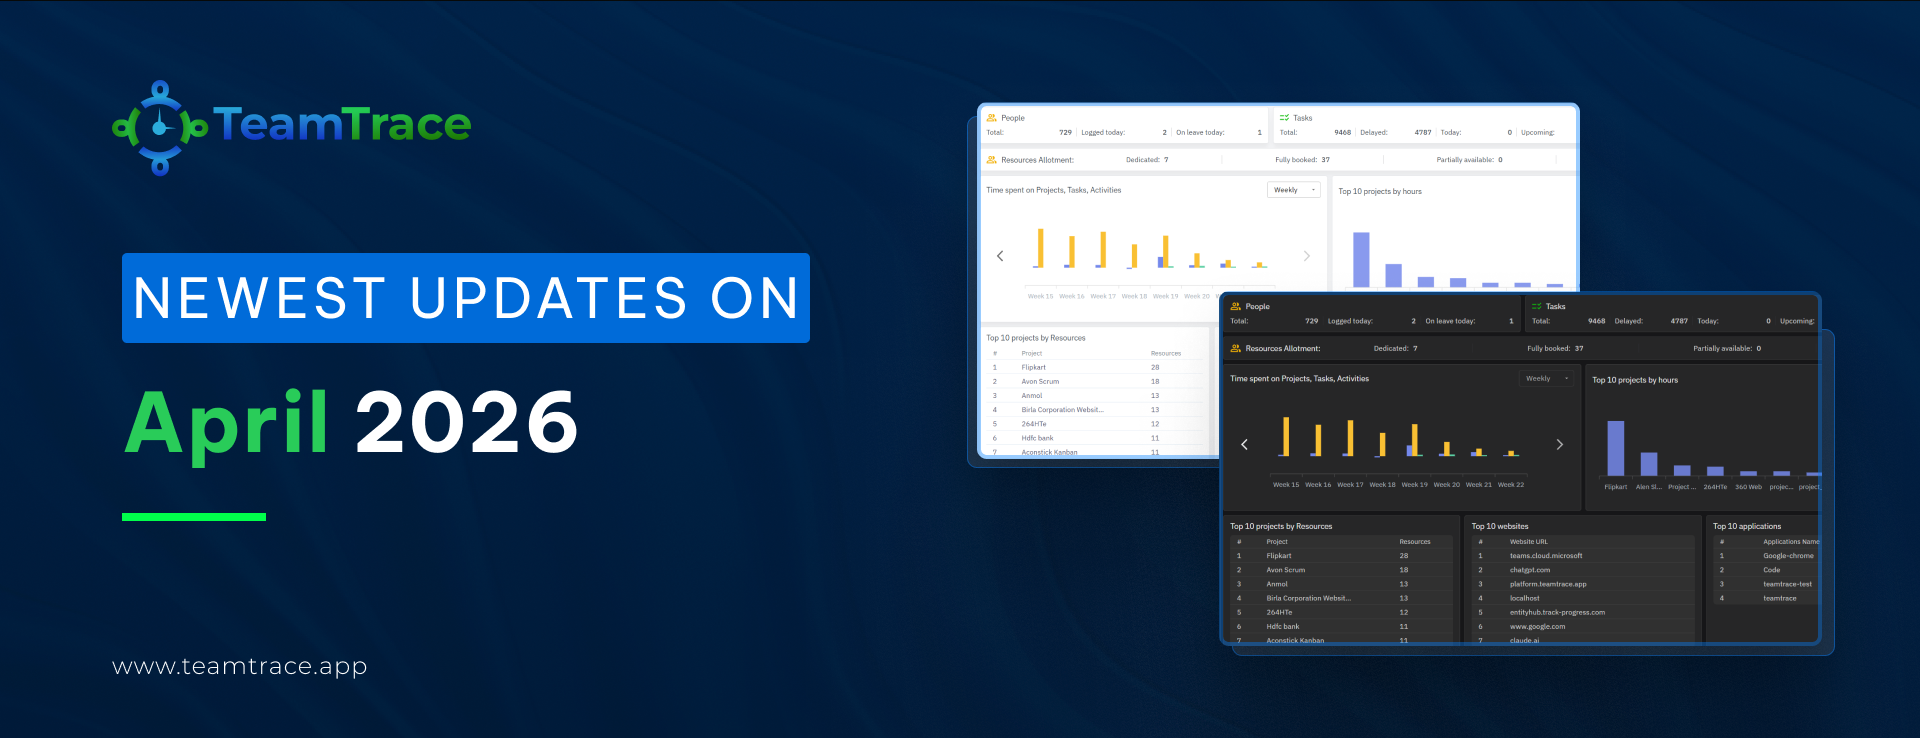
This month, we’ve gone deeper, refining reports, rethinking mobile, and redesigning the experience, so you lead with confidence.
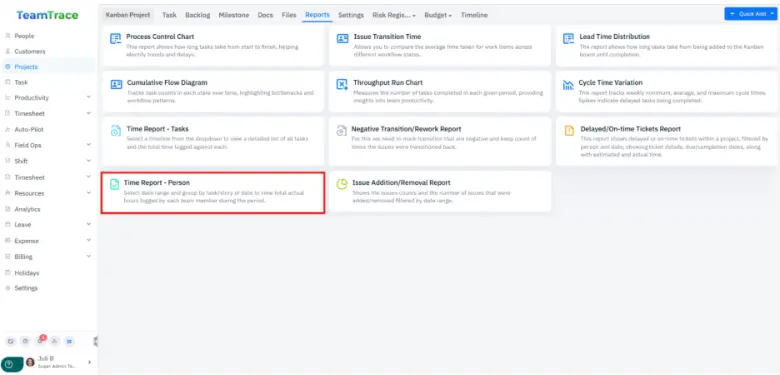
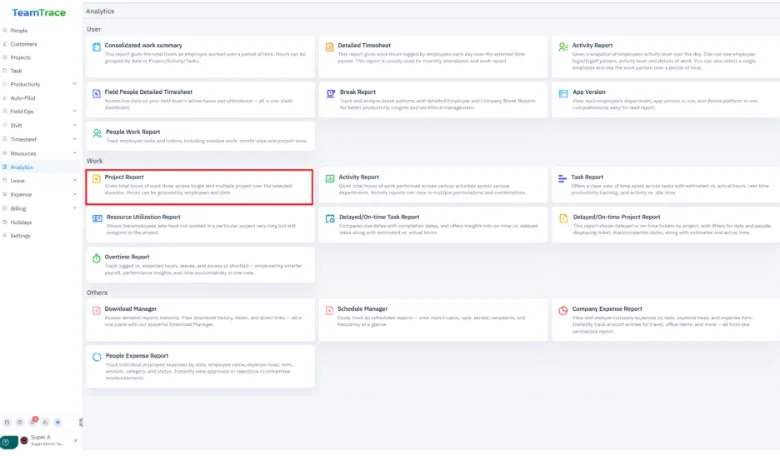
This report tracks how often tasks move backwards in the workflow. Every time an issue is sent back to a previous stage, it gets counted, helping you spot where work is getting stuck or reworked.
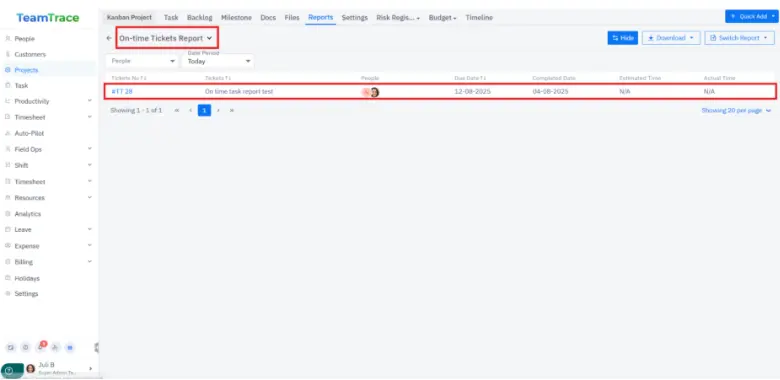
This report shows which tickets were finished late and which were completed on time. You can filter by person and date, and see details like ticket info, due date vs. completion date, plus estimated time vs. actual time spent.
Scenario: Delayed Task
A task is considered delayed when it’s completed after the due date or when the actual time taken is greater than the estimated time.
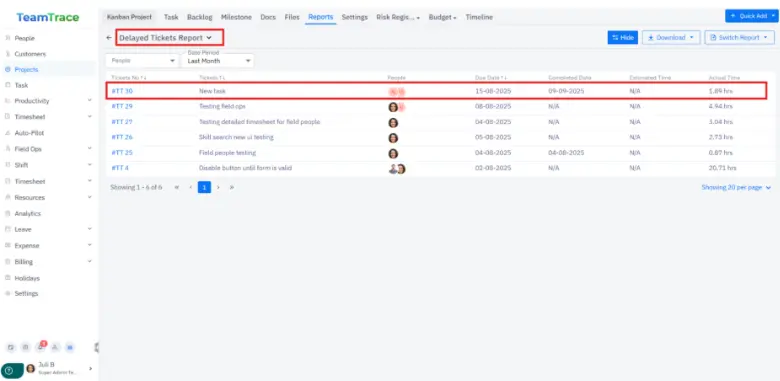
Scenario: for On-time task
A task is considered on-time when it’s completed on or before the due date and within the estimated time range.
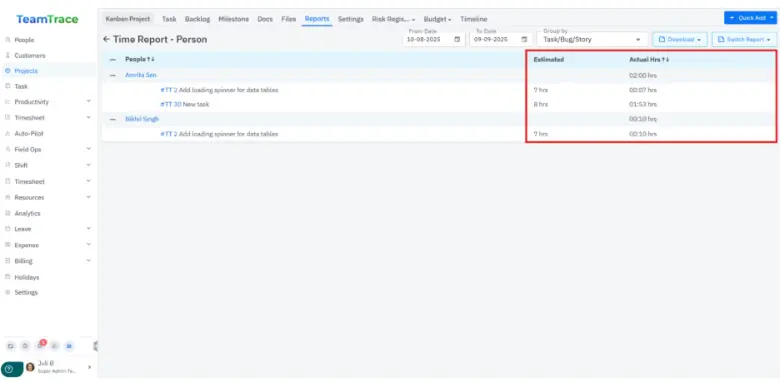
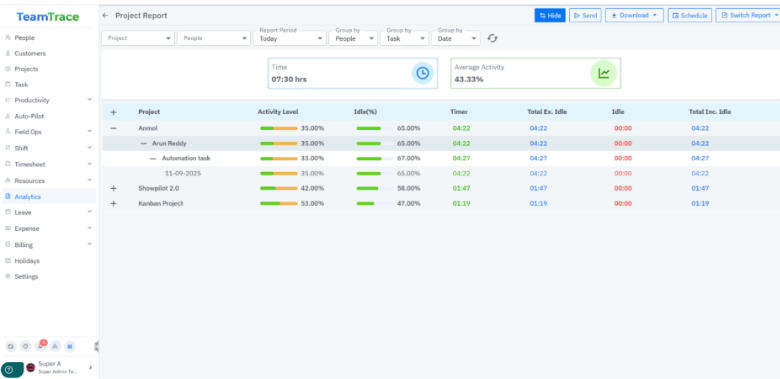
This report shows how many hours each team member logged within a selected date range. You can group the results by task or date to see the total actual hours worked during that period.
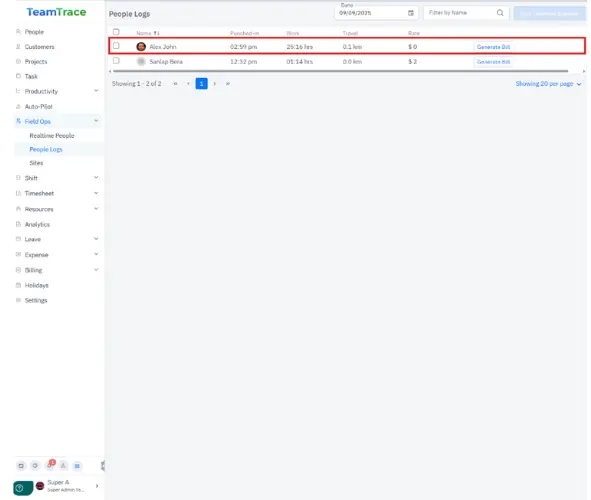
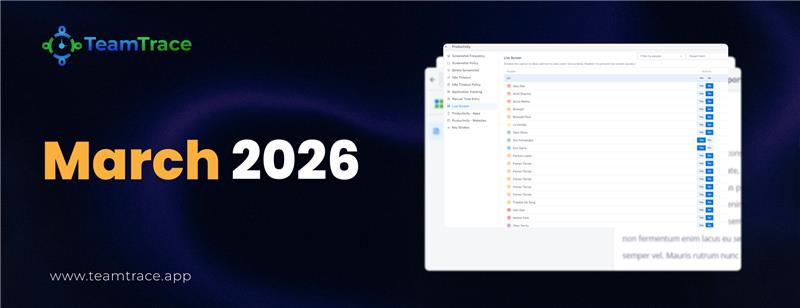
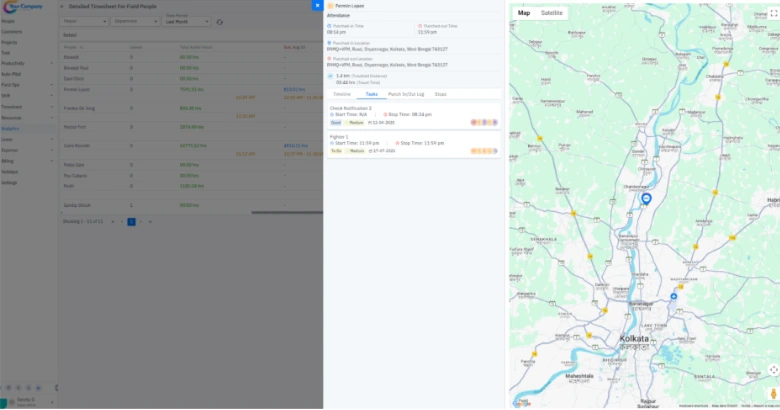
Admins now get a clearer view of field activity. The updated screen shows:
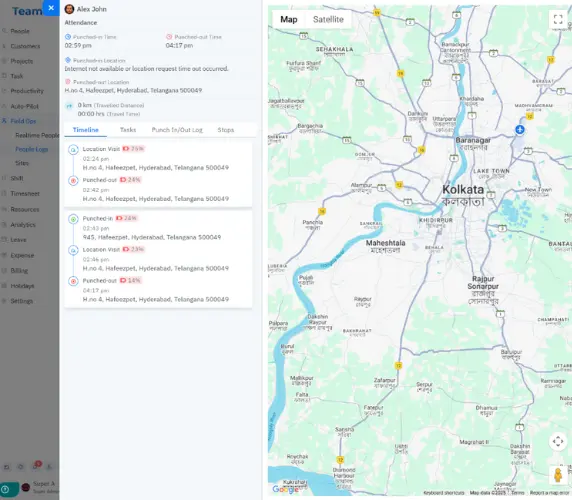
Stops: When an employee stays within 200 meters of the site for a set period of time, that location is recorded as a “Stop.”
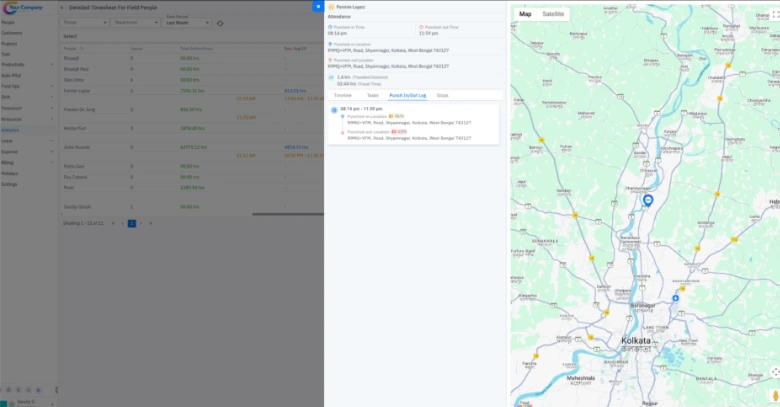
Punch In/Out Log: Keeps a record of when employees punch in and punch out during their workday.
Tasks: Displays the start and end times for each individual task.

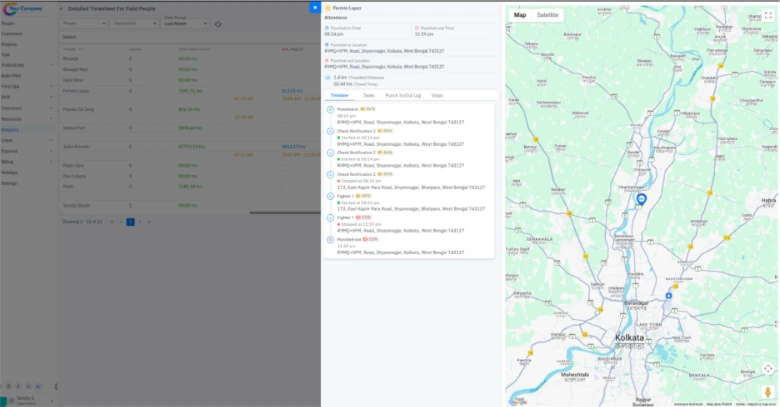
Timeline: A combined view that brings together task details and punch in/out times in one place.
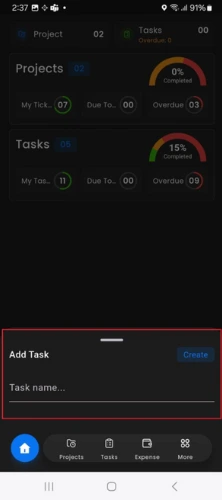
Quick Task Add during Punch-In → You can now add a task right when punching in. The task will appear in the final column of the project workflow (for example, “Completed”), making the task addition process faster and easier.
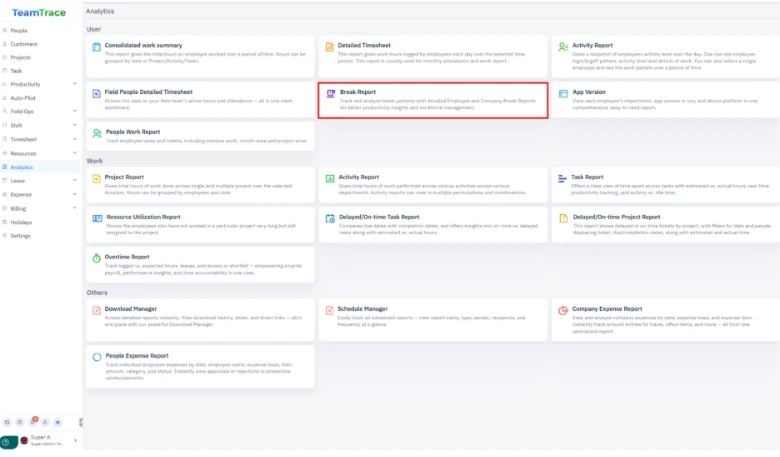
This report tracks when employees take breaks and for how long. It gives both individual and company-wide insights, helping you understand break patterns and manage productivity better.
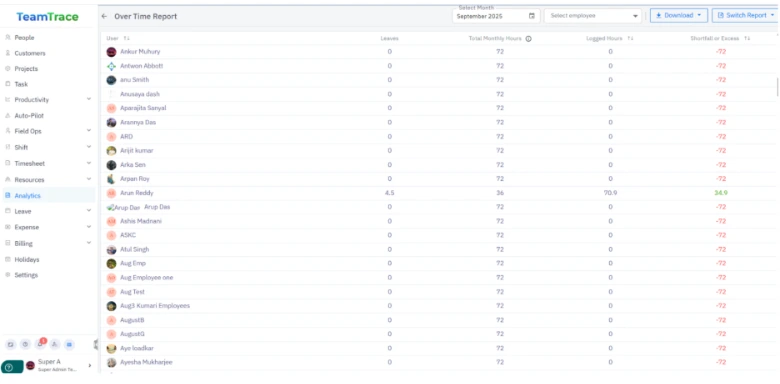
This report compares the hours employees actually logged with their expected hours. It also factors in leaves, extra hours, or shortfalls, giving you a complete view for payroll accuracy, performance tracking, and time accountability.
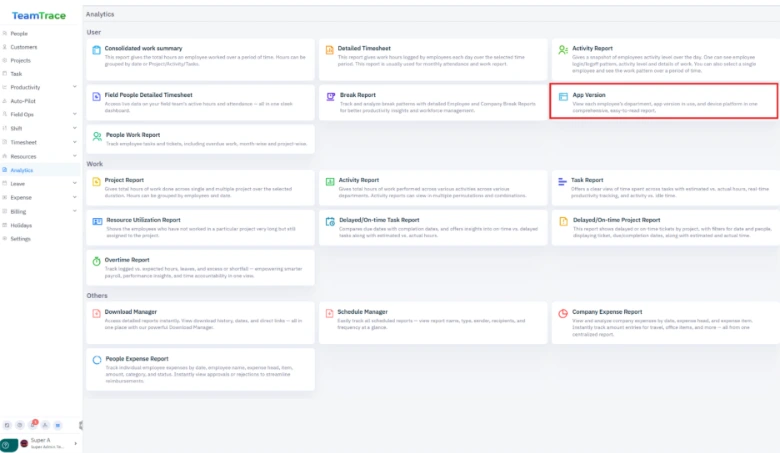
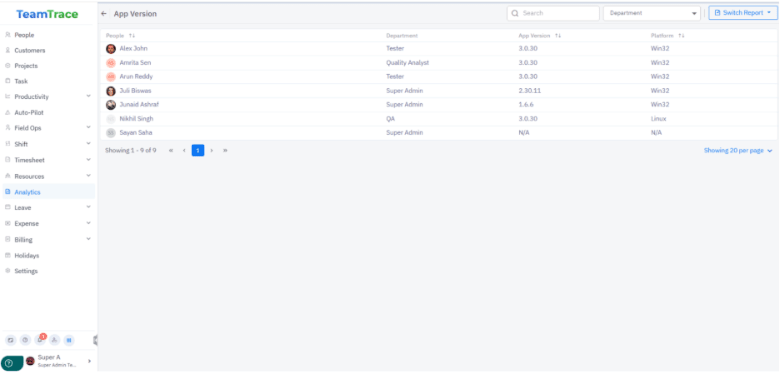
This report shows each employee’s department, the app version they’re using, and their device platform, all in one easy-to-read view.
Now includes a detailed ticket list for better visibility.
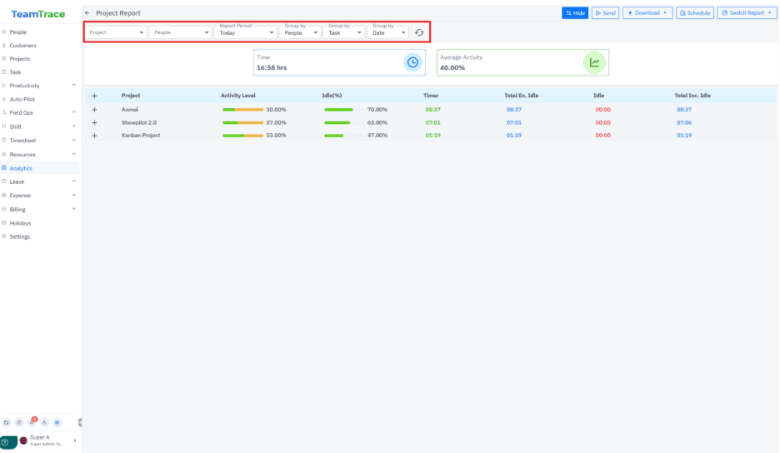
Added filter options, so you can view reports based on specific requirements.
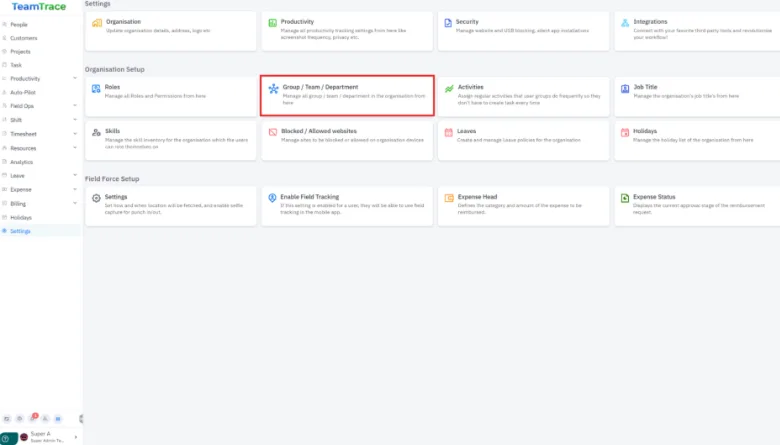
Default activity creation when creating a department. No more manual overhead.
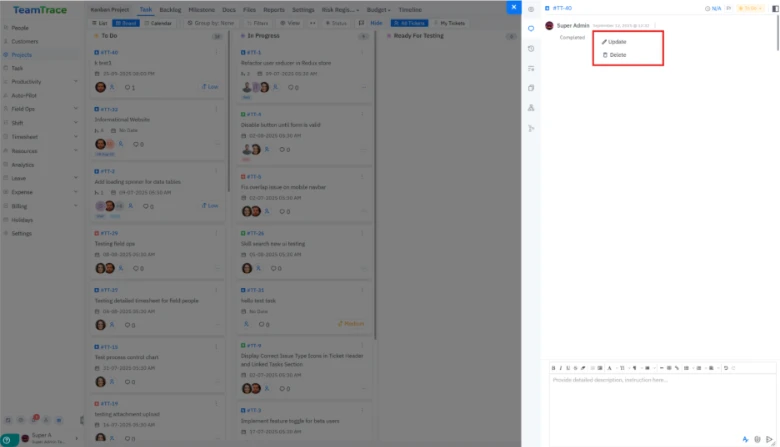
Comments: Add attachments + edit/delete your own comments.
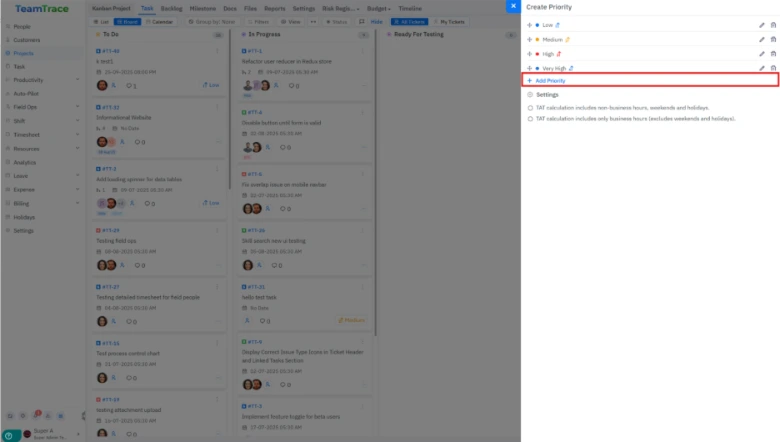
Custom Priority: Set it your way.
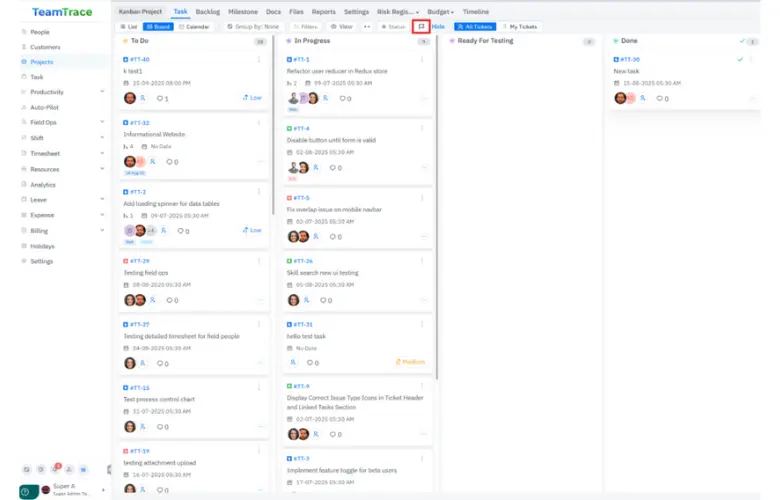
Tickets: Switch seamlessly between All Tickets and My Tickets.
Sidebar navigation has been redesigned for simplicity.
Tools don’t change businesses. What you do with them does.
These updates are levers of speed, accuracy, and control. They’re the difference between wondering what’s happening and knowing it in real time.
Your team is already moving. Now, it’s time to lead them faster, clearer, and smarter with TeamTrace.